
The average Waverley home sold for £559,306 in August, £11,402 down on a year ago. Only Woking fell further in Surrey, while Guildford turned positive.
The average home in Waverley sold for £559,306 in August. That is £11,402 less than in August last year, a fall of 2.0%.
The figures are from the Land Registry’s UK House Price Index for August 2026, published this week. They cover Waverley borough: Farnham, Godalming, Haslemere, Cranleigh and the villages between them.
Of Surrey’s 11 districts, only Woking had a steeper annual fall. Guildford, which was falling almost as fast as Waverley a month ago, is now up on the year.
UKHPI prices are a mean average, not a median. A few large sales lift the whole figure, which is why the borough average sits well above what most homes here sell for.
A better month, a worse year than it first looked
August’s average is £6,976 higher than July’s, a rise of 1.3% in a month. That is the good news.
The less good news is that July has been revised down. When we reported it last month, the index put July at £553,429, down 2.6% on the year. The August release restates July as £552,330, down 2.8%. That makes July the steepest annual fall in the past year, ahead of January’s 2.5%.
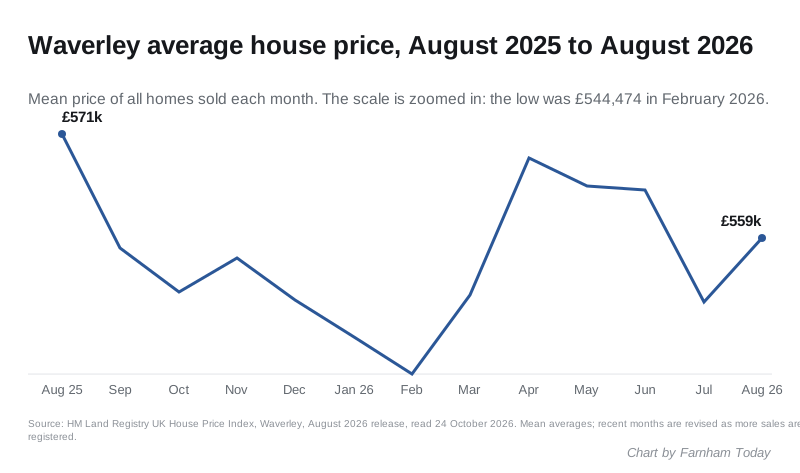
The past 13 months, as the August release now records them:
- August 2025: £570,708, the high point
- February 2026: £544,474, the low point
- April 2026: £568,073, after a spring recovery
- July 2026: £552,330
- August 2026: £559,306
Flats are still falling fastest
Every type of home in the borough is cheaper than a year ago. Flats and maisonettes have lost the most, and they have now been down on the year in every month since October 2025.
| Property type | Average price | Annual change |
|---|---|---|
| Detached | £936,989 | −1.8% |
| Semi-detached | £547,389 | −0.9% |
| Terraced | £428,533 | −1.0% |
| Flat or maisonette | £277,139 | −4.8% |
| All types | £559,306 | −2.0% |
The same release splits buyers four ways:
- First-time buyers paid an average of £398,716, down 1.8%.
- Movers (former owner-occupiers) paid £687,703, down 2.0%.
- Cash buyers paid £551,078, down 2.7%.
- Mortgage buyers paid £563,103, down 1.7%.
How Waverley compares
England as a whole was up 0.4% on the year, at £293,525. Surrey was down 0.2%, at £524,334. Five Surrey districts fell and six rose.
| Area | Average price | Annual change |
|---|---|---|
| Woking | £437,628 | −2.7% |
| Waverley | £559,306 | −2.0% |
| Spelthorne | £440,812 | −1.6% |
| Runnymede | £472,507 | −1.2% |
| Tandridge | £506,774 | −1.1% |
| Reigate and Banstead | £485,856 | +0.3% |
| Guildford | £537,660 | +0.6% |
| Elmbridge | £735,548 | +0.7% |
| Mole Valley | £552,344 | +1.4% |
| Surrey Heath | £457,981 | +1.5% |
| Epsom and Ewell | £566,163 | +3.2% |
| East Hampshire (neighbour) | £440,599 | −1.7% |
| Rushmoor (neighbour) | £326,799 | 0.0% |
The biggest change is next door. Guildford was down 2.3% in July, as the index now records it. In August it was up 0.6%. East Hampshire, which takes in Alton and Bordon just west of Farnham, was down 1.7%. Rushmoor, covering Aldershot and Farnborough, was flat.
Two cautions about these numbers
The recent months keep moving. The August release restates June at £564,585, down 0.1% on the year. Last month’s release had June at £560,886 and a fall of 0.7%. Revisions are routine, and they can be larger than a month’s change.
Sales counts lag. The newest month with a sales figure is June 2026: 105 sales across the borough, against 149 in June 2025. That figure will grow as more sales are registered. Last month the index gave May as 96 sales; it now says 107.
What it means for you
If you are selling, a borough average is a guide, not a valuation. It is £11,402 below last August and £8,767 below April’s spring high. Semi-detached and terraced houses have held their value best, both down about 1%.
If you are buying a flat, prices are 4.8% lower than a year ago, at an average of £277,139. That is the cheapest part of the market and the one first-time buyers most often reach.
If you are staying put, none of this changes your council tax. Bands are based on values at 1 April 1991. Our Farnham council tax bands page has this year’s charges.
For prices by Farnham postcode, taken from completed sales, see our Farnham house prices page. Last month’s figures are in our July house prices story.
Frequently asked questions
What is the average house price in Waverley?
£559,306 in August 2026, according to the UK House Price Index. That is a mean average for the whole borough. The index does not publish a separate figure for Farnham.
Are Waverley house prices going up or down?
Down over the year, up over the month. The average fell 2.0% between August 2025 and August 2026, but rose 1.3% between July and August.
Which type of home has fallen most?
Flats and maisonettes, down 4.8% to an average of £277,139. They have been down on the year in every month since October 2025.
Is Waverley falling faster than the rest of Surrey?
Yes. Surrey as a whole was down 0.2% and only Woking, down 2.7%, fell further than Waverley’s 2.0%.
Sources
- HM Land Registry, UK House Price Index, Waverley, August 2026: the borough average, annual and monthly change, property types, buyer types, the restated monthly series, the restated July and June figures and the sales counts. Read 24 October 2026.
- HM Land Registry UK House Price Index, same release, for each Surrey district, for Surrey, Guildford, East Hampshire, Rushmoor and England. Read 24 October 2026.
The UK House Price Index is published monthly and revised as later sales are registered. Figures are mean averages for the whole of Waverley borough, not for any one town or street.
Have your say