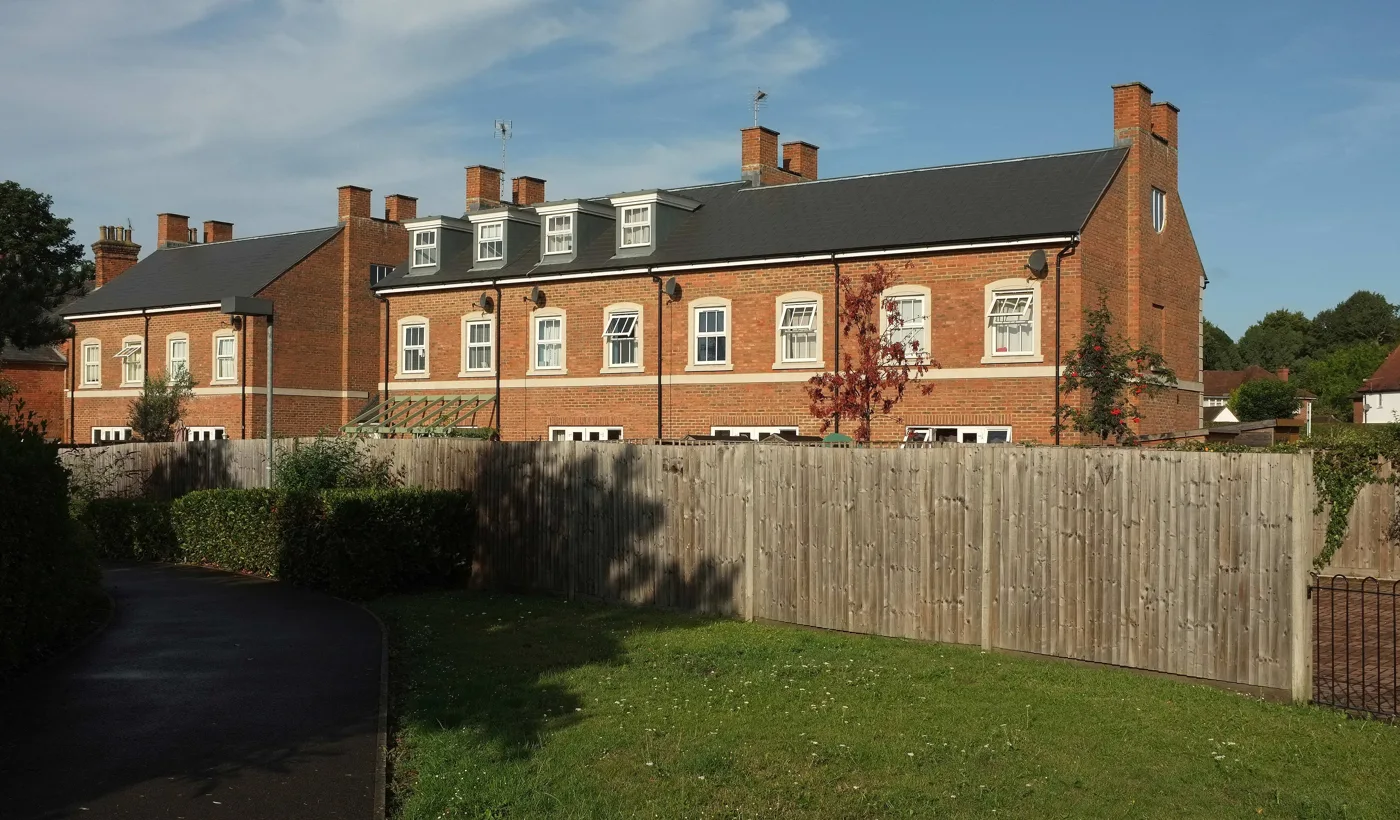

The average Waverley home, Farnham included, sold for £553,429 in July, £14,723 down on a year ago. That is the steepest annual fall since May 2024.
The average home in Waverley sold for £553,429 in July. That is £14,723 less than in July last year, a fall of 2.6%, and it is the steepest annual drop the borough has recorded since May 2024.
The figures are from the Land Registry’s UK House Price Index for July 2026, published this month. The area they cover is Waverley borough, which is Farnham, Godalming, Haslemere, Cranleigh and the villages between them.
One thing to hold on to before the numbers start. UKHPI prices are a mean average, not a median. A handful of large sales in a month pulls the whole figure up, and Waverley has plenty of those. The mean is why the borough average sits above half a million while most homes here change hands for considerably less.
The fall has come back, and it has got worse
Waverley’s annual change has been sliding since the summer of 2025, with one interruption. It went negative in December, recovered to a gain of 1.5% in May, then turned down again.
- July 2025: £568,152, up 4.7% on the year
- December 2025: £555,762, down 0.7%
- May 2026: £563,540, up 1.5%
- June 2026: £560,886, down 0.7%
- July 2026: £553,429, down 2.6%
The borough’s high point in the past 13 months was £570,332 in August 2025. July’s average is £16,903 below it.
You have to go back to May 2024, when prices were 3.6% down on the year, to find a steeper annual fall than this one.
Flats fell hardest, detached homes least
The drop is not spread evenly. Flats and maisonettes, the cheapest homes in the borough and the ones first-time buyers most often reach, lost the most value.
| Property type | Average price | Annual change |
|---|---|---|
| Detached | £928,184 | −2.5% |
| Semi-detached | £540,445 | −1.5% |
| Terraced | £422,493 | −1.8% |
| Flat or maisonette | £275,273 | −5.0% |
| All types | £553,429 | −2.6% |
Two other splits in the same release are worth reading:
- First-time buyers paid an average of £393,787, down 2.5% on the year.
- Former owner-occupiers, people moving from one home to another, paid £680,891, down 2.6%.
- Cash buyers paid £547,487, down 2.9%, and mortgage buyers £556,129, down 2.4%.
Surrey has split in two
This is the part a Farnham seller should care about most, because it says the fall is local rather than national.
England as a whole was up 1.1% in July, at an average of £293,479. Surrey as a county was down 0.4%. But that county figure is an average of districts pulling hard in opposite directions: four fell by more than 2%, and five rose.
Our nearest neighbours went different ways. Guildford was down 2.2%, to £532,917. East Hampshire, immediately west of Farnham and the district that takes in Alton and Bordon, was down 1.2%, to £440,541. Surrey Heath, which covers Camberley and Frimley, was up 4.0%.
Two cautions about these numbers
June has already been revised. When the June release came out, Land Registry put the Waverley average at £560,596 and the annual change at a fall of 0.8%. The July release restates June as £560,886 and a fall of 0.7%. Revisions like that are routine, they are usually small, and they are a reason not to treat any single month as settled.
There is no sales count yet for June or July. Land Registry publishes transaction volumes in arrears, and the July release carries none for either of the last two months. The most recent month with a figure is May 2026, at 96 sales across the whole borough, against 117 in May 2025. Recent volume figures fill in as more sales are registered, so treat them as incomplete rather than as evidence of a collapse in activity.
What it means for you
If you are selling, the borough-wide asking-price benchmark you may have been given in the spring is now out of date. Waverley’s average is £10,111 below its May figure and £16,903 below last August’s peak. A detached home is the type that held up best in percentage terms, a flat the worst.
If you are buying, the widest fall is in flats, down 5.0% over the year to an average of £275,273. That is the part of the market first-time buyers actually compete in, and it is the only type in the borough where the annual fall is steeper than the all-types figure.
If you are staying put, nothing here changes your bill. Council tax bands were set on values as at 1 April 1991 and are not revalued when prices move. Our Farnham council tax bands page has this year’s figures by band and parish.
For the longer view, with the price by street and the comparison against the rest of Surrey, see our Farnham house prices page. The supply side of this, and how many homes the borough has to find, is in Farnham planning news.
Frequently asked questions
What is the average house price in Farnham in 2026?
The official index does not publish a Farnham-only figure. It covers the whole of Waverley borough, where the average home sold for £553,429 in July 2026. For prices by Farnham postcode and sector, taken from completed sales rather than an index, see our Farnham house prices page.
Are house prices in Waverley going up or down?
Down. The borough average fell 2.6% in the year to July 2026, which is the steepest annual fall since May 2024. Surrey as a county fell 0.4% over the same period and England rose 1.1%.
Which type of home lost the most value?
Flats and maisonettes, down 5.0% over the year to an average of £275,273. Semi-detached houses held up best, down 1.5%.
Why is the Waverley average above half a million?
Because the UK House Price Index publishes a mean, not a median. A small number of very large sales lifts the whole figure, and Waverley has plenty of them: the borough average for a detached house alone is £928,184.
When is the next release?
The UK House Price Index is published monthly, and each release adds one month and revises the months before it. June’s figure has already been restated once, from £560,596 to £560,886.
Sources
- HM Land Registry, UK House Price Index, Waverley, July 2026 for the borough average, the annual change, the breakdown by property type, the first-time buyer, former owner-occupier, cash and mortgage averages, the monthly series back to July 2025, the restated June figure and the sales volumes. Read 22 September 2026.
- HM Land Registry UK House Price Index, same release, for every Surrey district in the chart, for Surrey, for East Hampshire and for England. Read 22 September 2026.
- Historic annual changes for Waverley back to January 2023, from the same index, for the comparison with May 2024.
The UK House Price Index is published monthly and revised as later sales are registered. Figures are mean averages for the whole of Waverley borough, not for any one town or street.
Have your say