
1,510 people in Waverley claimed jobless benefits in October, 15 fewer than September. Claimants aged 16 to 24 are up from 215 to 265 in a year.
1,510 people in Waverley were claiming unemployment-related benefits in October. That is 15 fewer than in September, but 60 more than a year earlier.
The Office for National Statistics published the October figures on Tuesday 17 November (ONS claimant count via Nomis).
The rise among young people is sharper. 265 claimants in the borough are aged 16 to 24, up from 215 in October 2025. That is an increase of 23 per cent in a year, against 4 per cent for all ages.
Overview
- Claimants in Waverley, October 2026: 1,510, down 15 on September and up 60 on October 2025.
- Claimant rate: 1.9 per cent of residents aged 16 to 64, joint lowest in Surrey with Mole Valley. The UK rate is 3.9 per cent.
- Aged 16 to 24: 265, up from 215 a year ago and 200 two years ago.
- In Farnham: the town’s eight wards have about 520 claimants between them. Farnham Castle, which covers the town centre, has the highest rate in the town at 2.8 per cent.
Young claimants up by a third in two years
The claimant count for 16 to 24 year olds in Waverley fell steadily after the pandemic. It reached a low of 140 in June 2023. It has risen since, and passed 250 for the first time since 2021 this spring (ONS via Nomis, 16 to 24 series).
The October figure of 265 is just below August’s 275. It is the highest October figure since 2020, when 495 young people in the borough were claiming.
| Age | Oct 2025 | Sep 2026 | Oct 2026 | Change over year |
|---|---|---|---|---|
| 16 to 24 | 215 | 260 | 265 | +50 |
| 25 to 49 | 820 | 800 | 780 | -40 |
| 50 and over | 415 | 460 | 465 | +50 |
| All ages | 1,450 | 1,525 | 1,510 | +60 |
The ONS rounds every figure to the nearest five, so the age groups do not always add exactly to the total.
The count among people aged 25 to 49 has fallen by 40 in a year. The whole of the rise is among the youngest and the oldest claimants. By sex, 805 claimants are men and 710 are women.
The claimant count covers people on Jobseeker’s Allowance and people on Universal Credit who are required to look for work. It is not the same as the unemployment rate. It can rise when benefit rules change as well as when jobs are lost, and the newest month is often revised slightly a month later.
Waverley against the rest of Surrey
Waverley’s rate of 1.9 per cent is the joint lowest of Surrey’s 11 districts and boroughs. Every one of them has more claimants than a year ago (ONS via Nomis, Surrey districts).
| District | Claimants, Oct 2026 | Rate | Oct 2025 |
|---|---|---|---|
| Spelthorne | 2,435 | 3.6% | 2,275 |
| Woking | 1,900 | 2.8% | 1,790 |
| Runnymede | 1,580 | 2.6% | 1,415 |
| Elmbridge | 2,175 | 2.5% | 1,975 |
| Tandridge | 1,345 | 2.5% | 1,340 |
| Surrey Heath | 1,360 | 2.3% | 1,285 |
| Epsom and Ewell | 1,130 | 2.2% | 1,100 |
| Reigate and Banstead | 2,190 | 2.2% | 1,990 |
| Guildford | 1,960 | 2.0% | 1,850 |
| Waverley | 1,510 | 1.9% | 1,450 |
| Mole Valley | 985 | 1.9% | 975 |
Farnham Castle ward has the town’s highest rate
The ONS also publishes the count for each of Waverley’s 24 wards (ONS via Nomis, Waverley wards). Farnham’s eight wards have about 520 claimants between them, roughly a third of the borough total.
Farnham Castle, which takes in the town centre, has 115 claimants and a rate of 2.8 per cent. Farnham Bourne has 25 and a rate of 0.8 per cent, the second lowest of any ward in Waverley.
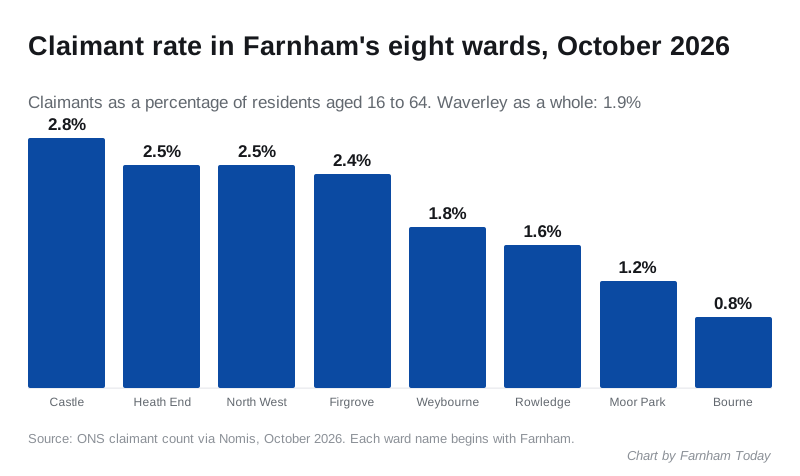
| Ward | Claimants | Rate | Change from September |
|---|---|---|---|
| Farnham Castle | 115 | 2.8% | +5 |
| Farnham Heath End | 80 | 2.5% | -5 |
| Farnham North West | 65 | 2.5% | +5 |
| Farnham Firgrove | 85 | 2.4% | +5 |
| Farnham Weybourne | 50 | 1.8% | no change |
| Farnham Rowledge | 60 | 1.6% | +5 |
| Farnham Moor Park | 40 | 1.2% | -5 |
| Farnham Bourne | 25 | 0.8% | no change |
Ward figures are small and rounded to the nearest five, so a change of five from one month to the next is within the rounding.
Elsewhere in the borough, the highest rates are in Alfold, Dunsfold and Hascombe, at 3.2 per cent with 50 claimants, and Godalming Central and Ockford, at 2.9 per cent with 95. The lowest is Ewhurst and Ellens Green, at 0.7 per cent.
What it means for you
Waverley’s claimant rate is less than half the UK rate of 3.9 per cent. But the number of young people looking for work has risen for two years, and October did not reverse that.
Anyone who has lost work can check what they could get and apply for Universal Credit on GOV.UK, and find their nearest Jobcentre Plus.
The November figures are due from the ONS in mid-December.
Have your say