
The average Waverley home sold for £560,795 in September, up 0.5% on a year ago and the first annual rise since June. Flats are still falling.
The average home in Waverley sold for £560,795 in September. That is £2,642 more than in September last year, a rise of 0.5%.
It is the borough’s first annual rise since June. In July and August the average was down on the year.
The figures are from the Land Registry’s UK House Price Index for September 2026, published on Wednesday. They cover Waverley borough: Farnham, Godalming, Haslemere, Cranleigh and the villages between them.
UKHPI prices are a mean average, not a median. A few large sales lift the whole figure, which is why the borough average sits well above what most homes here sell for.
Why the year now looks better
Most of the change comes from last year, not this one. September’s average is only £975 higher than August’s, a rise of 0.2% in a month.
What moved is the comparison. A year ago the average fell 2.2% in a single month, from £570,708 in August 2025 to £558,153 in September 2025. Measured against that lower starting point, this September comes out ahead.
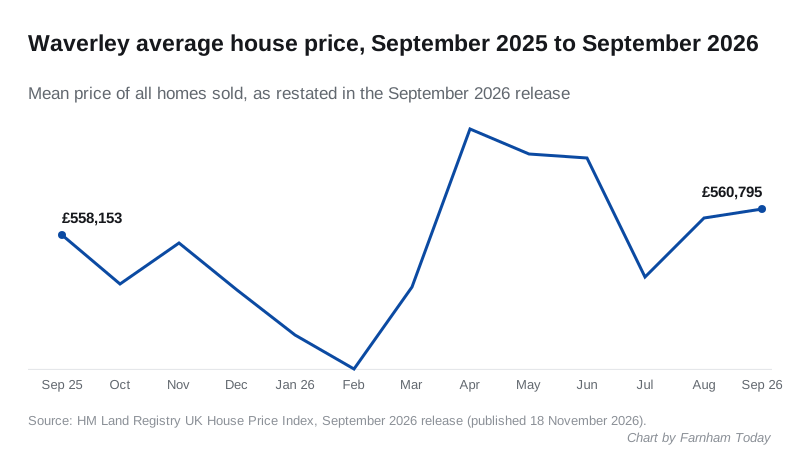
The past 13 months, as the September release now records them:
- September 2025: £558,153
- February 2026: £544,979, the low point
- April 2026: £568,579, the high point
- July 2026: £554,042
- September 2026: £560,795
The borough is still £15,870 below its peak. Waverley’s highest average was £576,665 in September 2022, so prices are 2.8% lower than four years ago.
Flats are still falling
Houses of every kind are now worth more than a year ago. Flats and maisonettes are the exception. They have been down on the year in every month since October 2025, twelve months in a row.
| Property type | Average price | Annual change |
|---|---|---|
| Detached | £940,030 | +0.8% |
| Semi-detached | £548,728 | +1.5% |
| Terraced | £428,671 | +1.0% |
| Flat or maisonette | £278,237 | −1.9% |
| All types | £560,795 | +0.5% |
The same release splits buyers four ways:
- First-time buyers paid an average of £399,435, up 0.6%.
- Movers (former owner-occupiers) paid £689,731, up 0.5%.
- Cash buyers paid £553,293.
- Mortgage buyers paid £564,240.
How Waverley compares
Surrey as a whole rose by the same 0.5%, to £524,471. England was up 0.8%, at £292,998. The South East was down 0.2%.
Waverley is the third most expensive district in Surrey. Only Elmbridge and Epsom and Ewell are dearer, and Epsom and Ewell is ahead by £1,600.
| Area | Average price | Annual change |
|---|---|---|
| Tandridge | £497,914 | −3.0% |
| Reigate and Banstead | £480,209 | −1.4% |
| Runnymede | £474,108 | −1.3% |
| Woking | £441,783 | −0.4% |
| Spelthorne | £442,566 | −0.1% |
| Mole Valley | £546,904 | +0.3% |
| Waverley | £560,795 | +0.5% |
| Guildford | £539,247 | +1.1% |
| Surrey Heath | £464,274 | +1.6% |
| Elmbridge | £740,883 | +3.2% |
| Epsom and Ewell | £562,395 | +4.1% |
| East Hampshire (neighbour) | £443,579 | −0.1% |
| Rushmoor (neighbour) | £328,774 | +0.9% |
| Hart (neighbour) | £483,876 | +3.6% |
A month ago Waverley had the second steepest annual fall in Surrey. Five districts are now falling and six are rising. Waverley’s 0.5% is the second smallest of the six rises.
Over the Hampshire border, East Hampshire, which takes in Alton and Bordon, is almost flat. Rushmoor, covering Aldershot and Farnborough, is up 0.9%. Hart, which includes Fleet, is up 3.6%.
Two cautions about these numbers
The recent months keep moving. Last month we reported August at £559,306, down 2.0% on the year. The September release restates August as £559,820, down 1.9%. July has been revised up too, from £552,330 to £554,042.
Sales counts lag. The newest month with a sales figure is July 2026: 125 sales across the borough, against 208 in July 2025. That figure will grow as more sales are registered. Last month the index gave June as 105 sales; it now says 119.
What it means for you
If you are selling, a borough average is a guide, not a valuation. The average is up £2,642 on the year but still £7,784 below April’s high. Semi-detached houses have done best, up 1.5%.
If you are buying a flat, prices are 1.9% lower than a year ago, at an average of £278,237. The fall is smaller than in August, when flats were down 4.6% on the revised figures.
The October figures are due in December.
Sources: HM Land Registry UK House Price Index, September 2026 release, and its full data file for Waverley, the other Surrey districts, East Hampshire, Rushmoor, Hart, Surrey, the South East and England.
Have your say